University of California, Berkeley
University of Toronto
Abstract: We introduce a set of life table equations for estimating the number of living kin over ages using readily-available data on fertility and mortality. These equations extend the classic measurement strategy of Goodman et al. (1974, 1975) by offering a way to estimate kin counts under demographic conditions that need not be stationary over time. We demonstrate a practical application of this technique: the derivation of a kin dependency ratio (KDR)—a measure of expected kin support burden—which we compare to the total age dependency ratio (TADR), a commonly-reported measure of public support burden in aging populations. We end with an overview of the immediate next steps for this project.
Starting in the mid-1960s a line of demographic research began to develop a formal measurement strategy for estimating the number of living kin (hereafter: kin availability) from fundamental demographic rates. Recognizing that kinship (biologically-defined) was heavily determined by rates of fertility and mortality, population researchers began to elaborate a set of methods to estimate kin availability from these quantities. This research culminated in a set of formal life table equations by Goodman, Keyfitz, and Pullum (1974) that enabled this estimation under stable population assumptions. These equations represented the strongest effort, at that time, to formally relate the structure of kinship to its demographic determinants; and they opened up exciting new possibilities for systematically exploring the relationship between fertility, mortality, and kinship wherever data on such quantities could be found.1
In recent years, interest in demographic measurements of kin availability has been increasingly driven by material concerns surrounding the aging of populations. A 2015 report by the United Nations Population Division predicts that by the year 2050, the world’s share of people aged 60 years or older will increase almost two-fold from one-in-eight persons to one-in-five (United Nations, Department of Economic and Social Affairs 2015). This unprecedented shift in the age distribution raises the question of how society will organize to materially support the post-retirement population as its growth outpaces that of the working-age population.
A diverse literature has emerged surrounding this issue.2 Broadly speaking, researchers distinguish between public and private mechanisms of old-age support. Public support systems, in this context, typically refer to public pension programs (e.g. Social Security in the United States) or other in-kind transfer programs that are largely funded by the working age population. The old age dependency ratio (OADR)—usually defined as the number of individuals 65 years or older divided by the number of “working-age” individuals (15-64 years old)—provides a rough measure of the likely support burden faced by these public systems.3
As for private mechanisms of old-age support, the family is the principal vehicle (R. Lee and Donehower 2011). Especially in nations where public old age support is scarce, the family is likely to be the primary source of material support for dependent elders. Curiously, there are no widely-reported measures of expected family support burden like there are for the expected public support burden (i.e. the OADR just mentioned). This is likely due to the general dearth of data on kinship structures. While the OADR derives entirely from readily-observed population age distributions, an analogous kin dependency ratio (KDR) would require information, not only about the age of individuals in a population, but also about how those individuals are related to one another via familial ties.
In this paper, we present an extended version of Goodman and Colleague’s classic method of calculating kin availability as a reasonable estimation strategy when actual data on kinship is absent. Our method relies solely on readily-available age-specific fertility and mortality data and a set of easily-calculable life table equations. We improve on Goodman’s original method by dropping the stationary population assumption, thus allowing for the estimation of kin availability as a function of demographic rates that need not be constant over time. Then, as a demonstration of the practical applicability of this type of estimation, we define a kin dependency ratio as a measure of expected kin support burden, which we compare to existing total age support ratios (a generalization of the OADR) across a sample of countries at different points in time.
In Goodman, Keyfitz, and Pullum (1974), a method is laid out by which the expected number of living female relatives of different relations (e.g. mothers, daughters, etc.) is derived from age-specific rates of survival and fertility. For example, the number of surviving daughters to a woman of age \(a\) (\(a>{\alpha}\)) at time \(t\) is given by the formula:
\[ \int_{\alpha}^a l_{a-x} m_x dx \]
Here, \(m_x\) is the number of female births to a woman of age \(x\) and \(l_{a-x}\) is the proportion of girls surviving to age \(a-x\) (i.e. alive when mother is age \(a\)).
Applying the same logic recursively, a formula for the number of grand-daughters can be derived:
\[ \int_{\alpha}^a \left[\int_{\alpha}^{a-x}l_y m_y l_{a-x-y}dy \right] m_x dx \]
Here, \(y\) indexes the daughter’s age (i.e. the age of the mothers of the grand-daughters being counted).
Now moving up generations, the probability of mother’s survival can also be written in terms of age-specific survival and fertility:
\[ M_1(a) = \int_{\alpha}^{\beta} \frac{l_{x+a}}{l_x} W(x|t-a)dx \]
Here, \(\frac{l_{x+a}}{l_x}\) is the mean probability that a mother who gave birth to a girl who is now age \(a\) (when the mother was age \(x\)) is still alive; and \(W(x|t-a)\) is the age distribution (at time \(t-a\)) of women who gave birth to a daughter at time \(t-a\). In their original paper, the authors assumed a stable population, such that
\[W(x|t-a) = W(x) = l_xm_xe^{rx}\]
where \(r\) is the intrinsic population growth rate. Conveniently, the \(M(a)\) function can be recursively re-written to characterize the probability of any older-generation maternal ancestor. For example, grandmother’s survival is given by:
\[ M_2(a) = \int_{\alpha}^{\beta} M_1(a+x) W(x|t-a)dx \]
The main extension of Goodman’s method, which we present here, is to allow rates of fertility and mortality to vary over time. Accounting for this variation is important because: (a) rates of fertility and mortality across much of the world have shifted dramatically over the last several decades; and (b) the availability of living kin is likely to be highly sensitive to generational changes in these rates. As written and presented, the original kin availability equations by Goodman, Keyfitz, and Pullum (1974) assume that age-specific rates of survival and fertility remain constant. In order to derive more historically-plausible estimates of kin availability from these data, we propose a simple set of adjustments that allow time to enter the equation in an intuitive way.
If cohort rates were readily available, we would be able to calculate the above expressions representing the true changes in fertility and mortality over time. However, in practice usually only period data are readily available across a wide range of counties. In addition, the cohort approach quickly becomes rather data intensive, given the number of different cohorts involved in each of the calculations. For example, if we were trying to calculate the expected number of daughters to a mother aged 50, we would need the full set of cohort fertility rates for that mother, plus survival information for seven separate cohorts for the daughters.
To best utilize the period data available, we index Goodman’s method to the mean age at childbearing. This centers the period fertility schedule so that the fertility rates at the time of peak childbearing (25-30 years) is correct for that particular cohort of women. For daughters, the equation becomes
\[ \int_{\alpha}^a l_{a-x}(t^*) \cdot m_x(t^*) dx \]
where \(t^*\) is the year in which the woman of age \(a\) was aged the mean age at childbearing \(A\). Thus \(m_x(t^*)\) is the fertility rate at age \(x\) in the year \(t^*\). If age \(a\) is less than \(A\), then \(t^*\) is just set to be the current period. Note that the mean age of childbearing may vary depending on the population and time period being considered.
In a similar way, the expected number of surviving granddaughters is estimated as:
\[ \int_{\alpha}^a \left[\int_{\alpha}^{a-x}l_y(t^*) \cdot m_y(t'_x) \cdot l_{a-x-y}(t'_x)dy \right] m_x(t^*) dx \]
where \(t'\) is the year in which the daughters who were born when the woman was age \(x\) reach mean child bearing age. This year changes based on the age \(x\).
For the older kin, i.e. mothers and grandmothers, we utilize Goodman’s original formulation where the age distribution of women of reproductive age is a function of time, i.e. \(W(x|t-a)\). Thus the formulas are as above in the previous section. Both survival quantities are indexed to time \(t\). In future work we will investigate other methods for time-indexing the survival quantities.
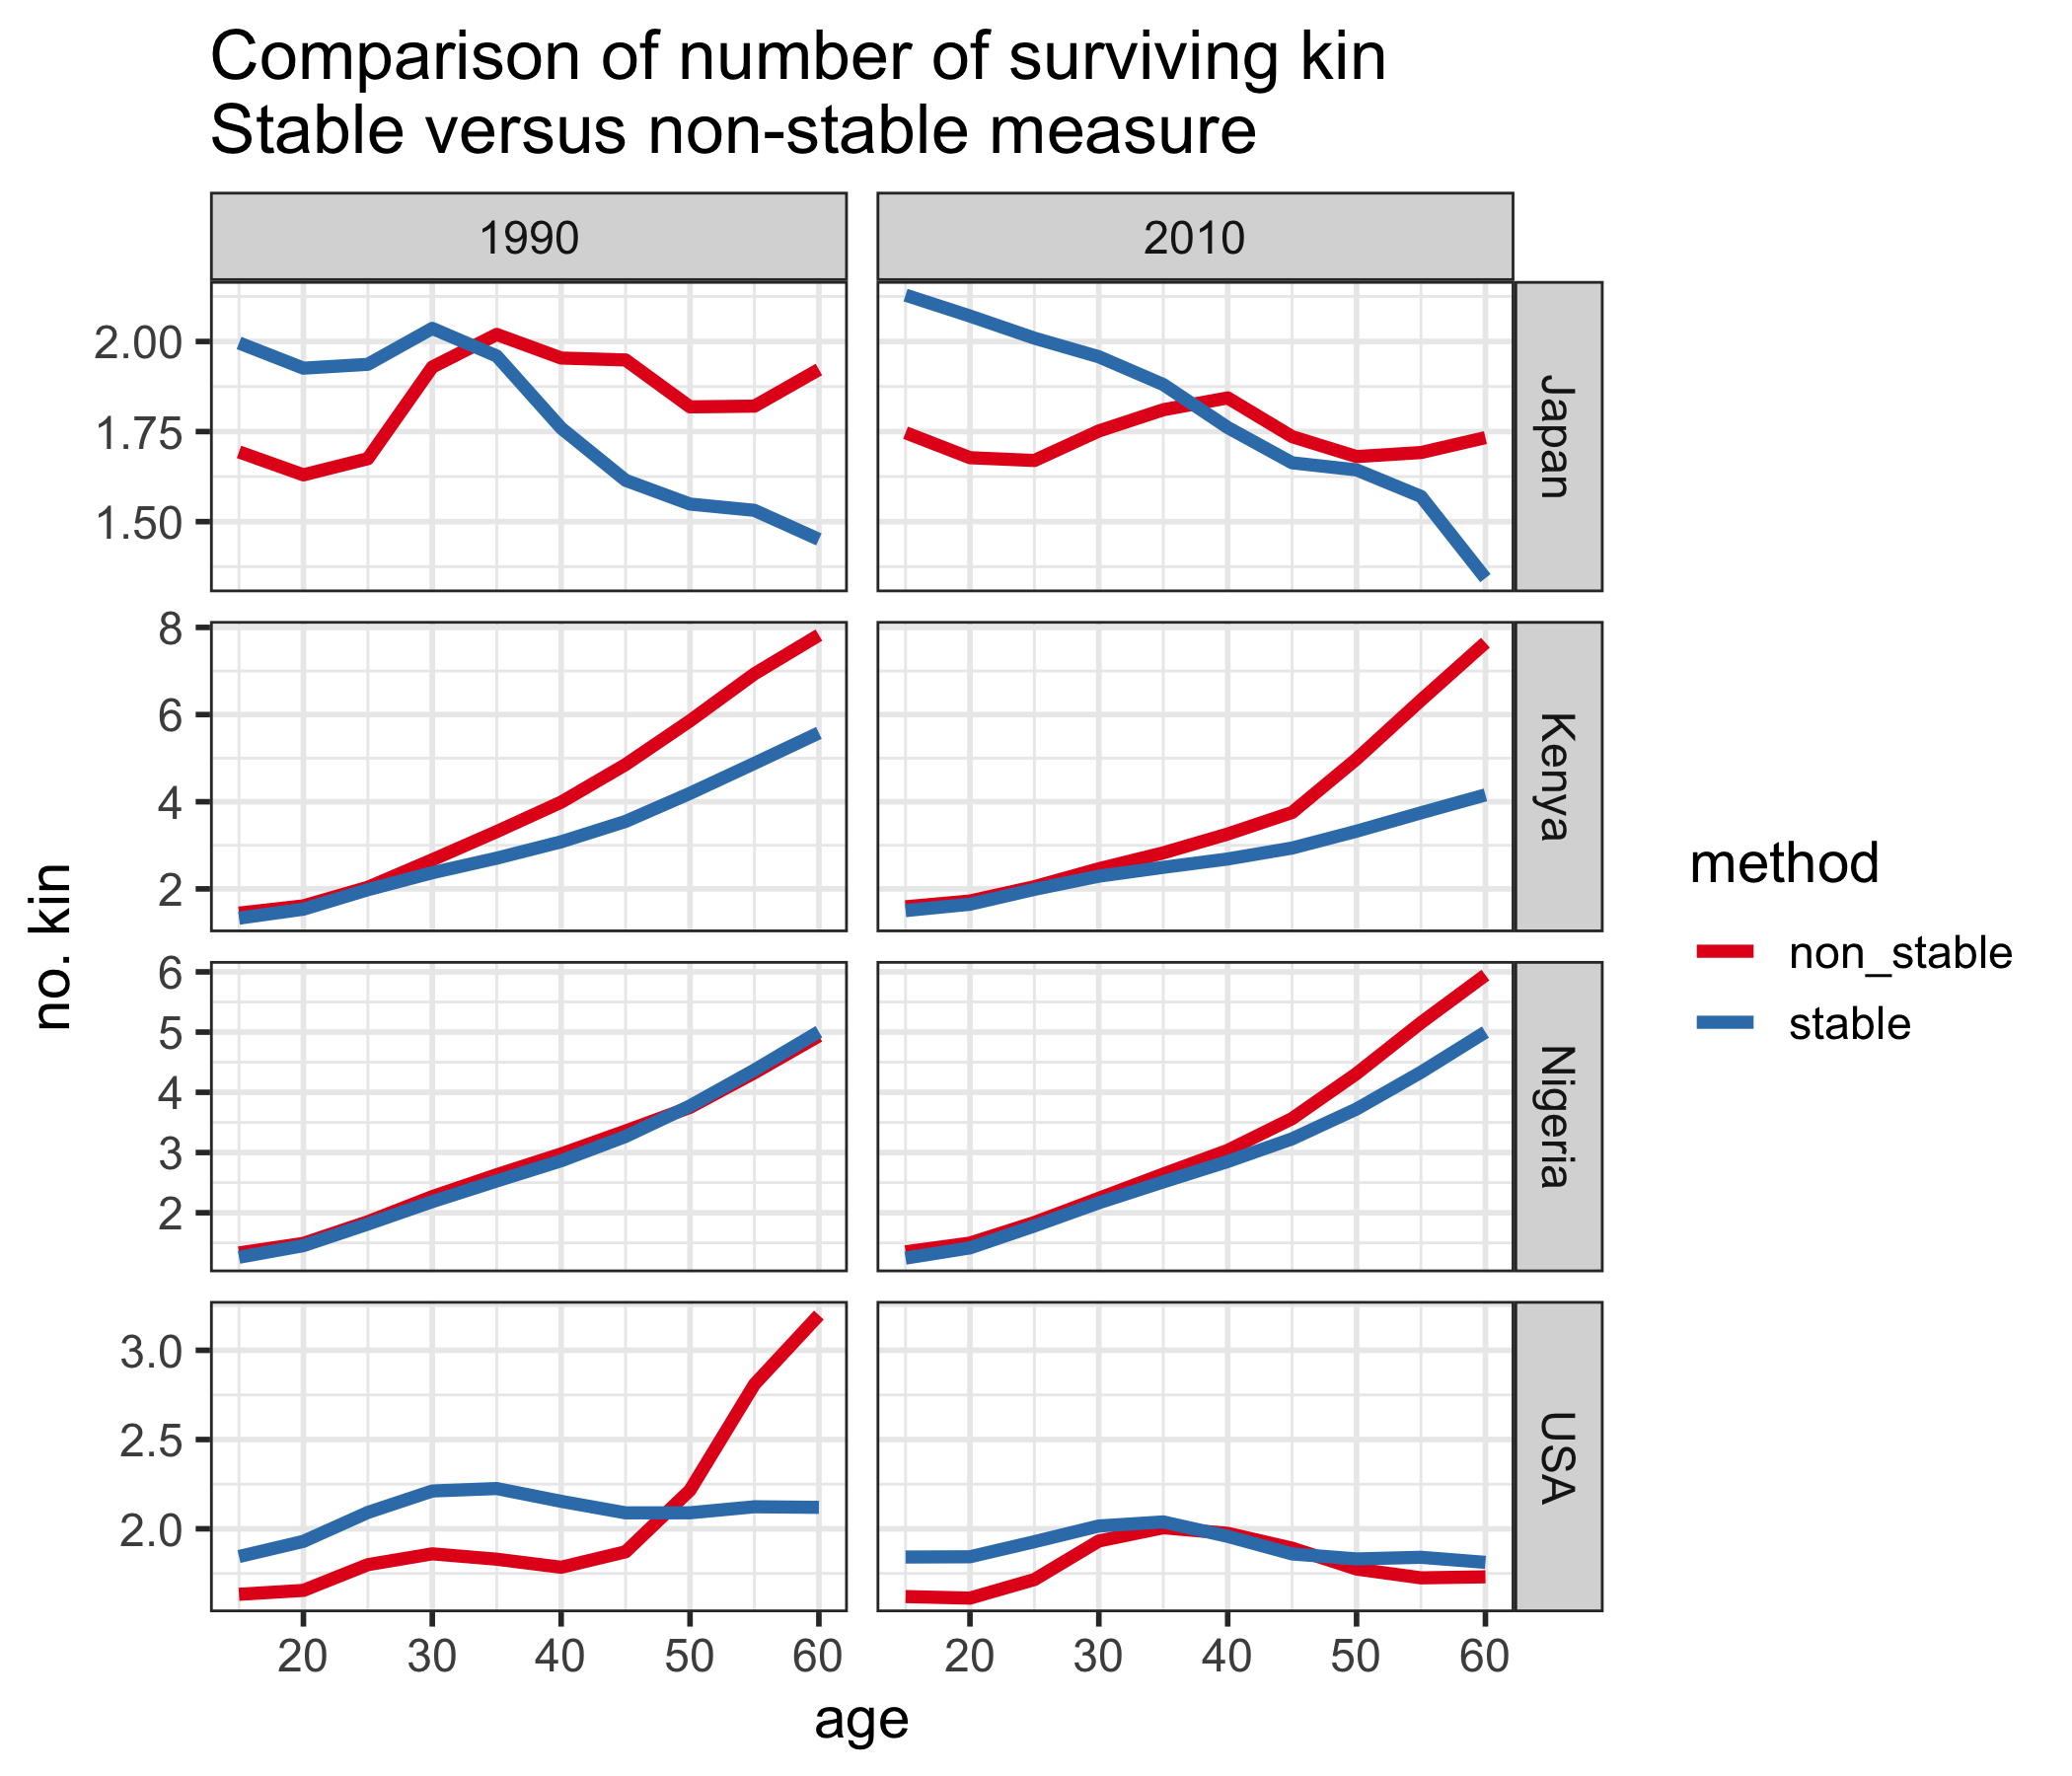
In Figure 1, we plot total kin counts (i.e. the sum of grandmothers, mothers, daughters, and grand-daughters) over age for a selection of countries in 1990 and 2010. We compare the original Goodman method (labeled “stable”) and the non-stable method presented above (labeled “non_stable”). Period fertility and mortality rates, and age distributions are obtained from the 2017 edition of the World Population Prospects, produced by the United Nations.4
For most countries, there is a noticeable difference in the estimates produced by the two methods. The exception is Nigeria in 1990, where fertility and mortality rates were such that the population was almost stable, so the two methods are very similar. By 2010, Nigeria’s fertility had decline, and so the stable method does not account for higher fertility in the past, as illustrated by the discrepancy at older ages. The same is true for Kenya. For Japan, there are discrepancies at both young and old ages, due to both a decline in fertility and mortality rates. In the USA, noticeably the stable method in 1990 does not account for the baby boom, which substantially increases the number of kin for 50-60 year olds.
Figure 2 shows the expected number of surviving kin over age for a selection of countries in the year 2010, broken down by kin type.
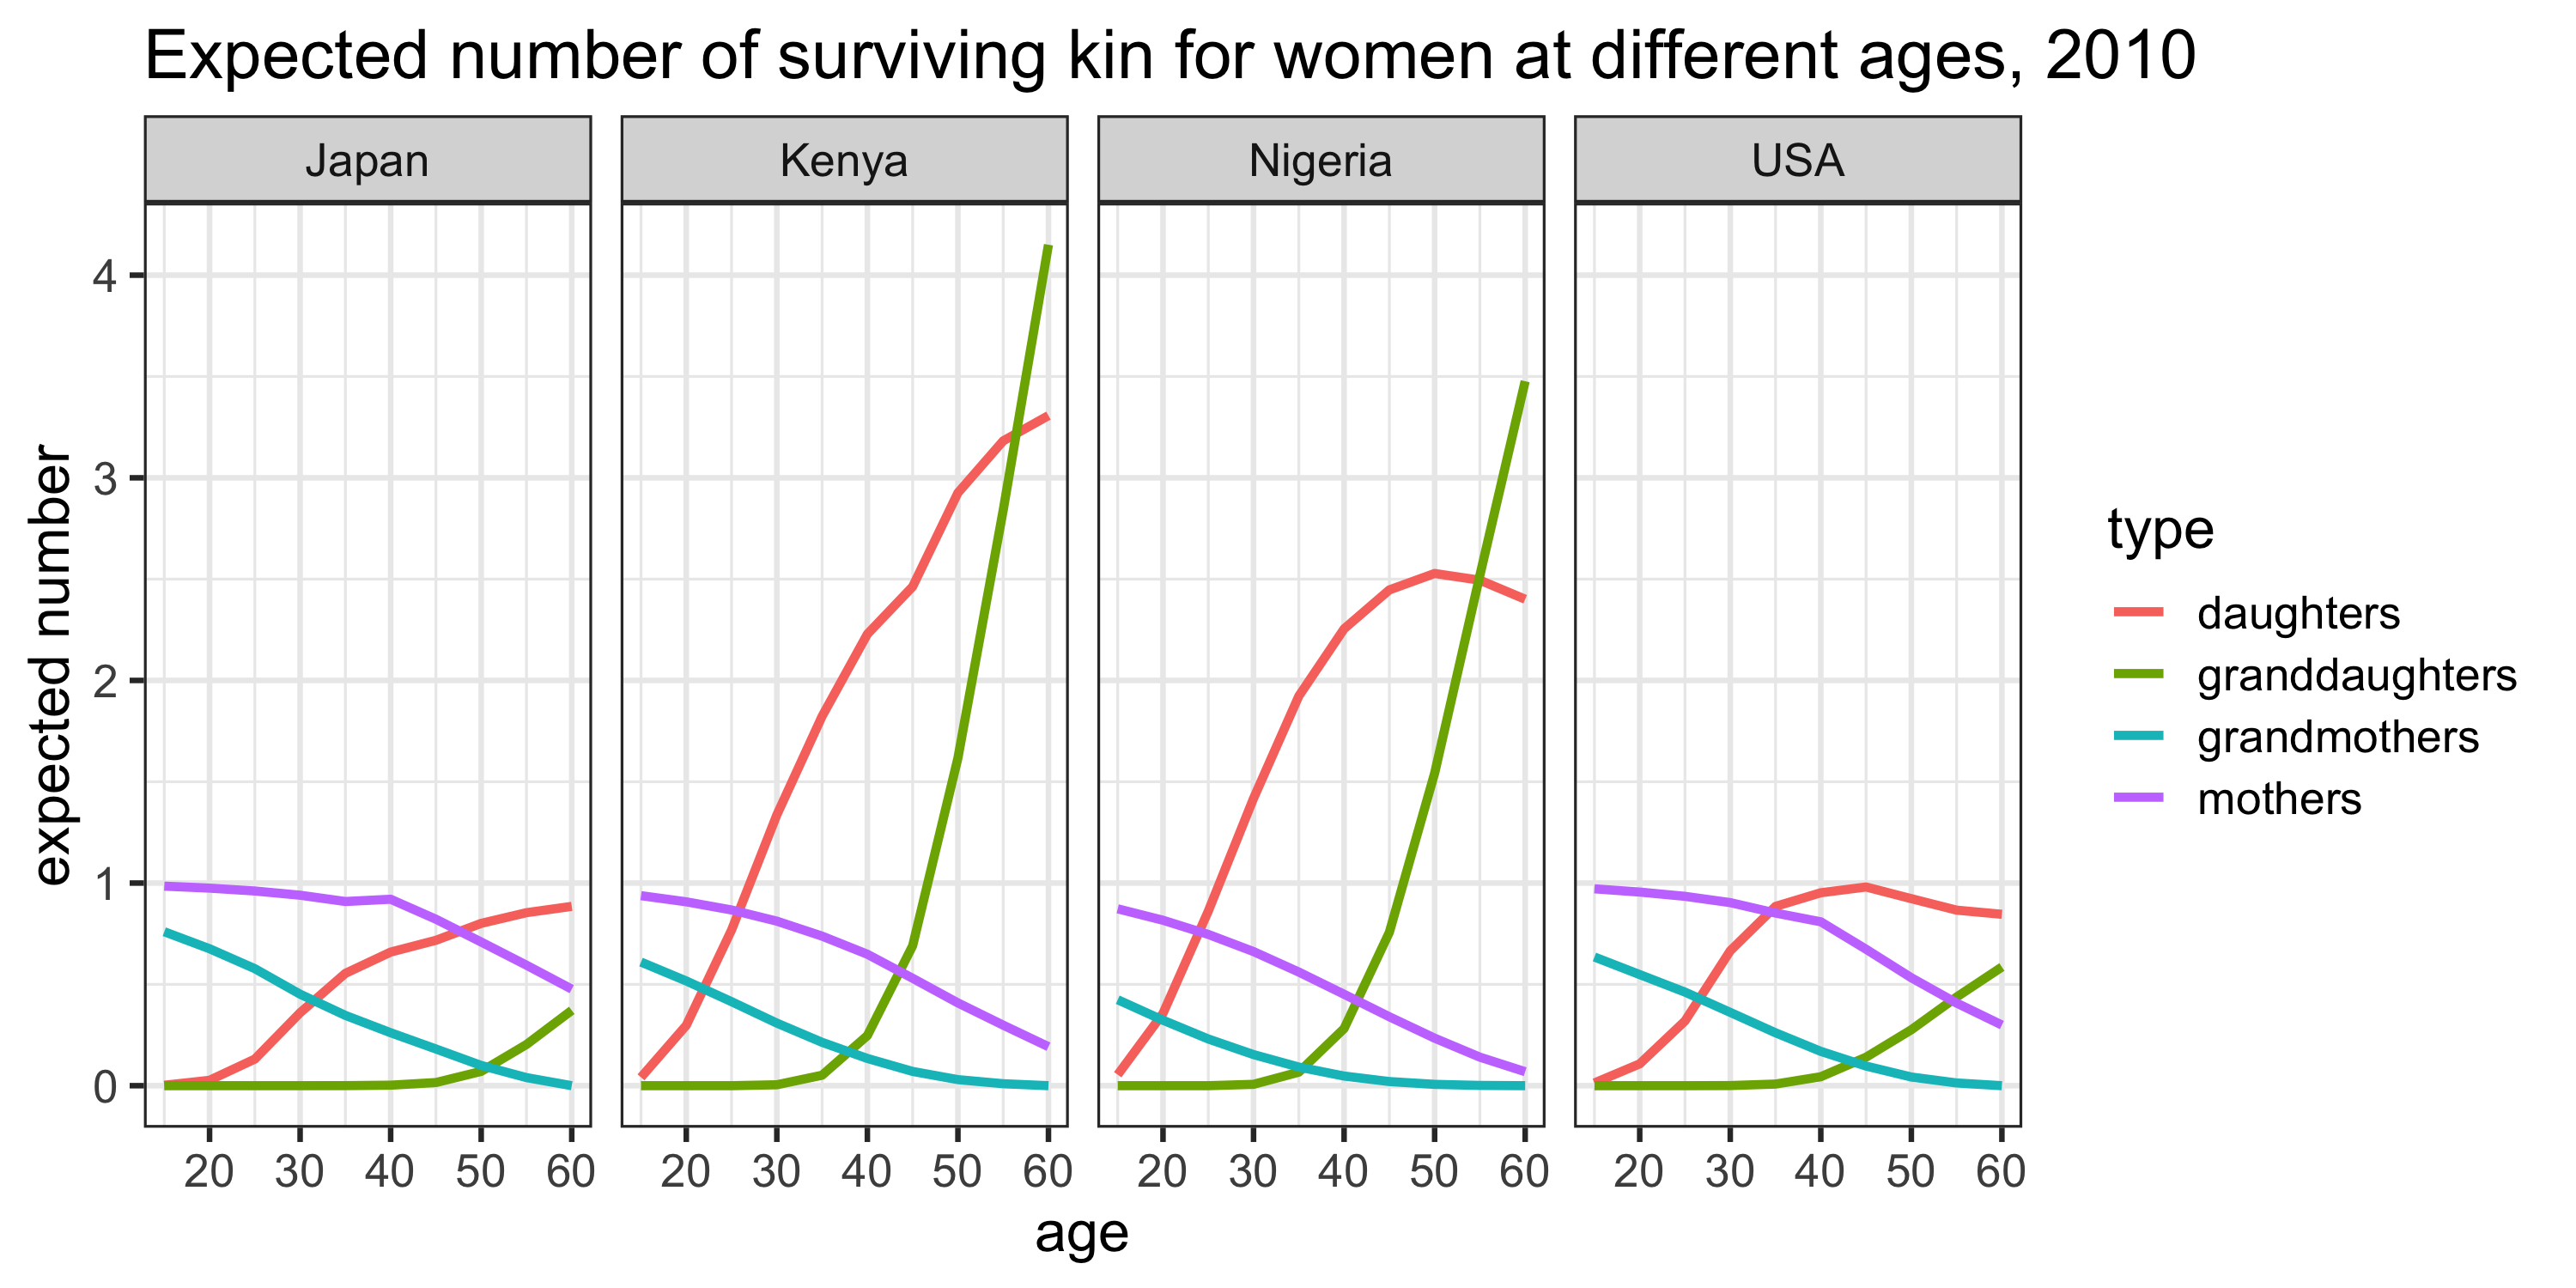
The most striking feature of these plots is the much larger expected numbers of daughters and grand-daughters in Kenya and Nigeria (versus the USA or Japan) at each age. This is, of course, a function of historically higher birth rates in these countries. On the other hand, we observe much higher expected numbers (i.e. survival probabilities) of mothers and grand-mothers in the USA and Japan (versus Kenya or Nigeria) at each age. This is a consequence of historically lower death rates in these countries. Thus, we see how both the fertility and mortality experiences of these populations are naturally reflected in these kin availability estimates.
We define a kin dependency ratio (KDR) as the number of plausibly dependent kin at age \(x\) divided by the number of plausibly non-dependent kin at age \(x\):
\[ KDR(x) = \frac{\text{dependent kin at age x}}{\text{non-dependent kin at age x}} \]
“Dependent kin” is defined along two dimensions: (1) The type of kin; and (2) the age of ego. For example, a daughter or grand-daughter is likely to be a dependent when ego is younger, but when ego is older, those same daughters and grand-daughters are likely to be independent (and possibly even sources of material support). For the purposes of the present demonstration, we define dependent kin to be daughters and grand-daughters when ego is 44-years or younger; daughters, granddaughters, mothers, and grandmothers when ego is age 45 to 64; and mothers and grandmothers when ego is 65-years or older (Table 1).
Table 1. Dependent kin types by age of ego
| Ages | Who counts as “dependent kin”? |
|---|---|
| 0–44 | daughters, grand-daughters |
| 45–64 | daughters, grand-daughters, mothers, grandmothers |
| 65+ | mothers, grandmothers |
These age boundaries are based on our own sense of plausible values, but could—in better practice—be defined in any number of more scientifically-rigorous ways. However, for the sake of demonstration, they suit our needs well enough.
To consider the kin dependency ratio over the whole population, we take the weighted average of the age-specific KDRs, where the weights are based on the age distribution:
\[ KDR = \sum_{x=0}^{85} \frac{KDR(x) \cdot w_x}{\sum w_x} \]
where \(w_x\) is the proportion of the female population aged \(x\).
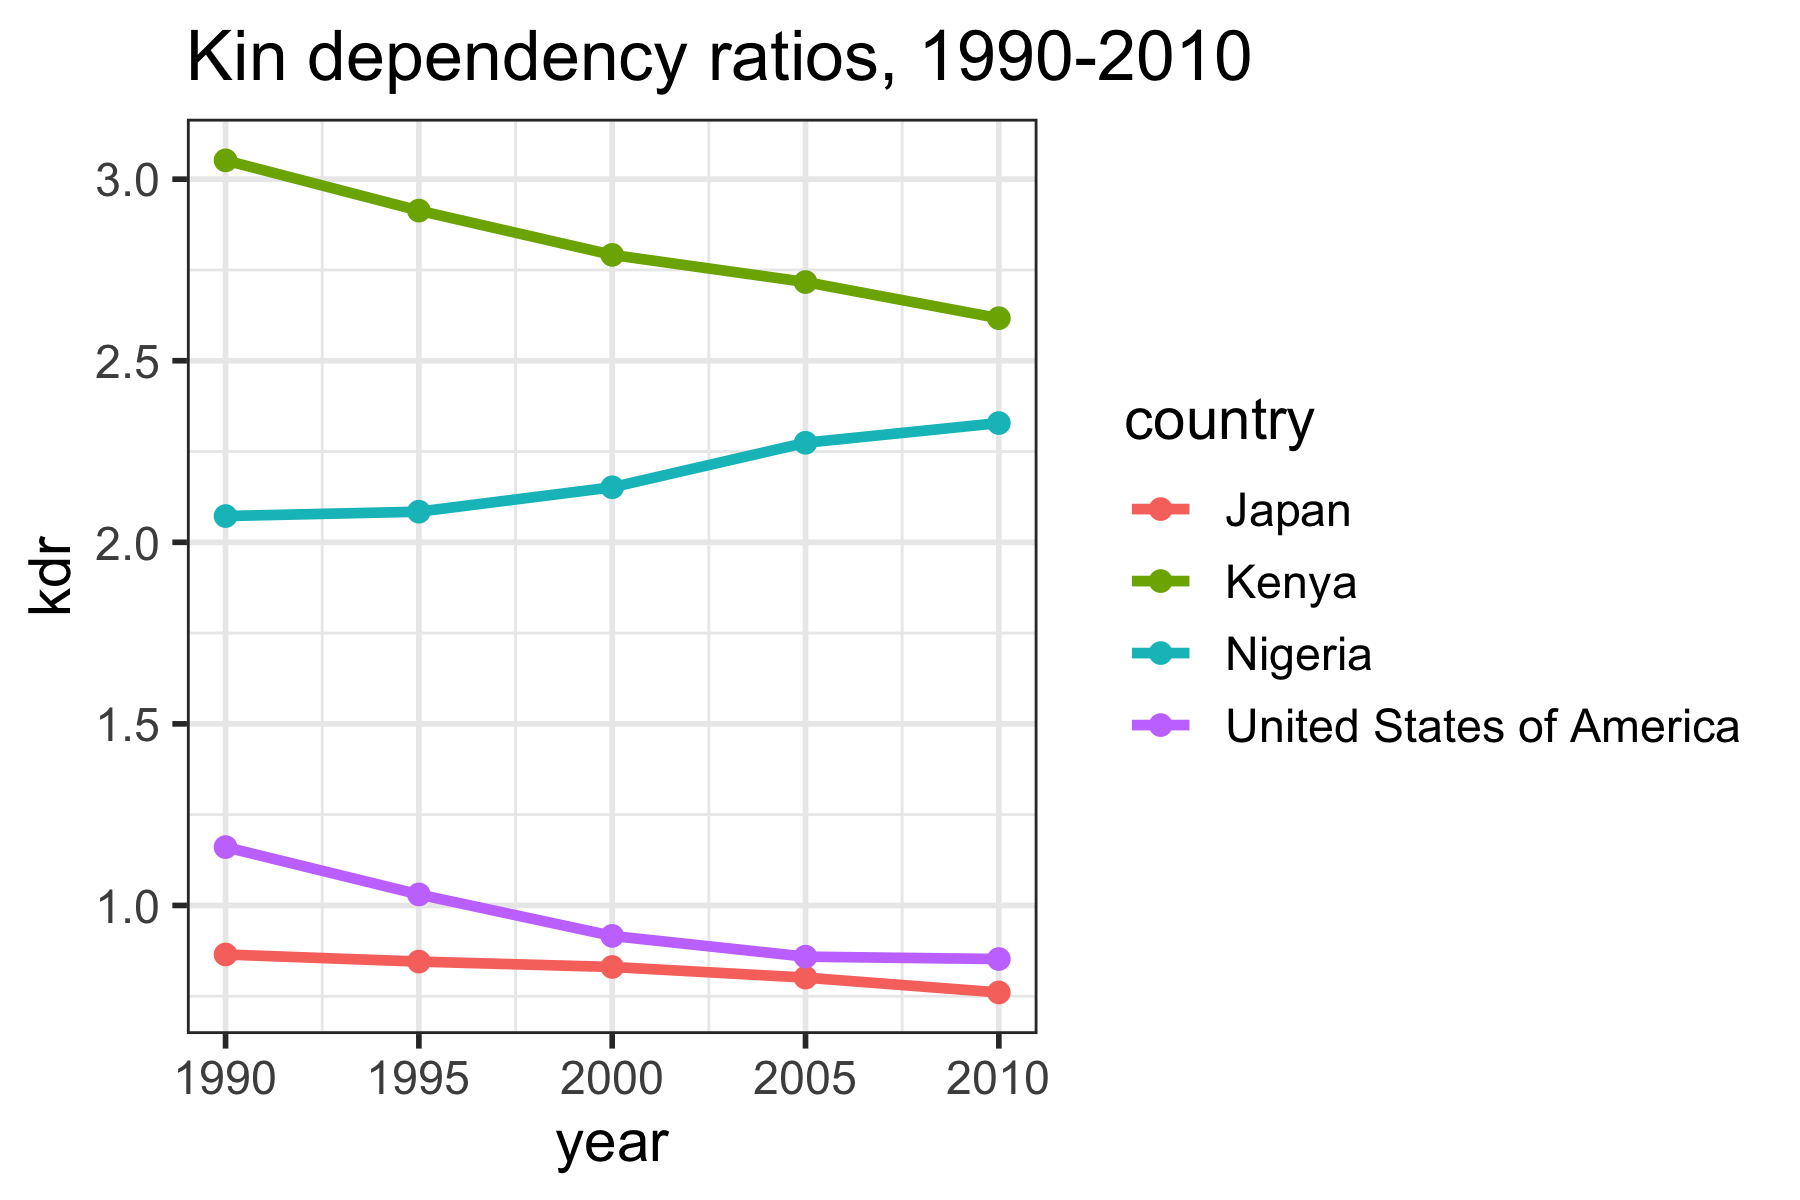
The following is a plot of KDR for a selection of countries over the period 1990–2010 (Figure 3). For Kenya and the United States, the KDR has decreased over time as fertility has declined. In Nigeria, while fertility has declined, mortality has also declined, which has led to an increase in the KDR. In Japan, where both fertility and mortality are very low, the KDR has remained relatively constant.
A more general version of the old age dependency ratio (OADR) is called the total age dependency ratio (TADR). The TADR includes in its numerator, not only those 65-years and older, but also those 14-years and younger. The motivation for a measure like the TADR is that while the OADR can be viewed as a rough measure of the old-age support burden faced by public programs funded largely by the working age population, the TADR can be viewed as a rough measure of the old-age plus the young-age burden faced by these public programs. The KDR (examined over the so-called “working ages,” 14-64), can be viewed similarly as a rough measure of the private support burden faced by families. Thus, comparing the TADR and the KDR can provide a useful (even if rough) summary of the likely public versus private support burden that comes with population aging.
The following is a plot of the mean KDR (measured over ages 14-64) and the TADR over the period 1990–2010 for a selection of countries that vary in their demography and relative levels of economic development.
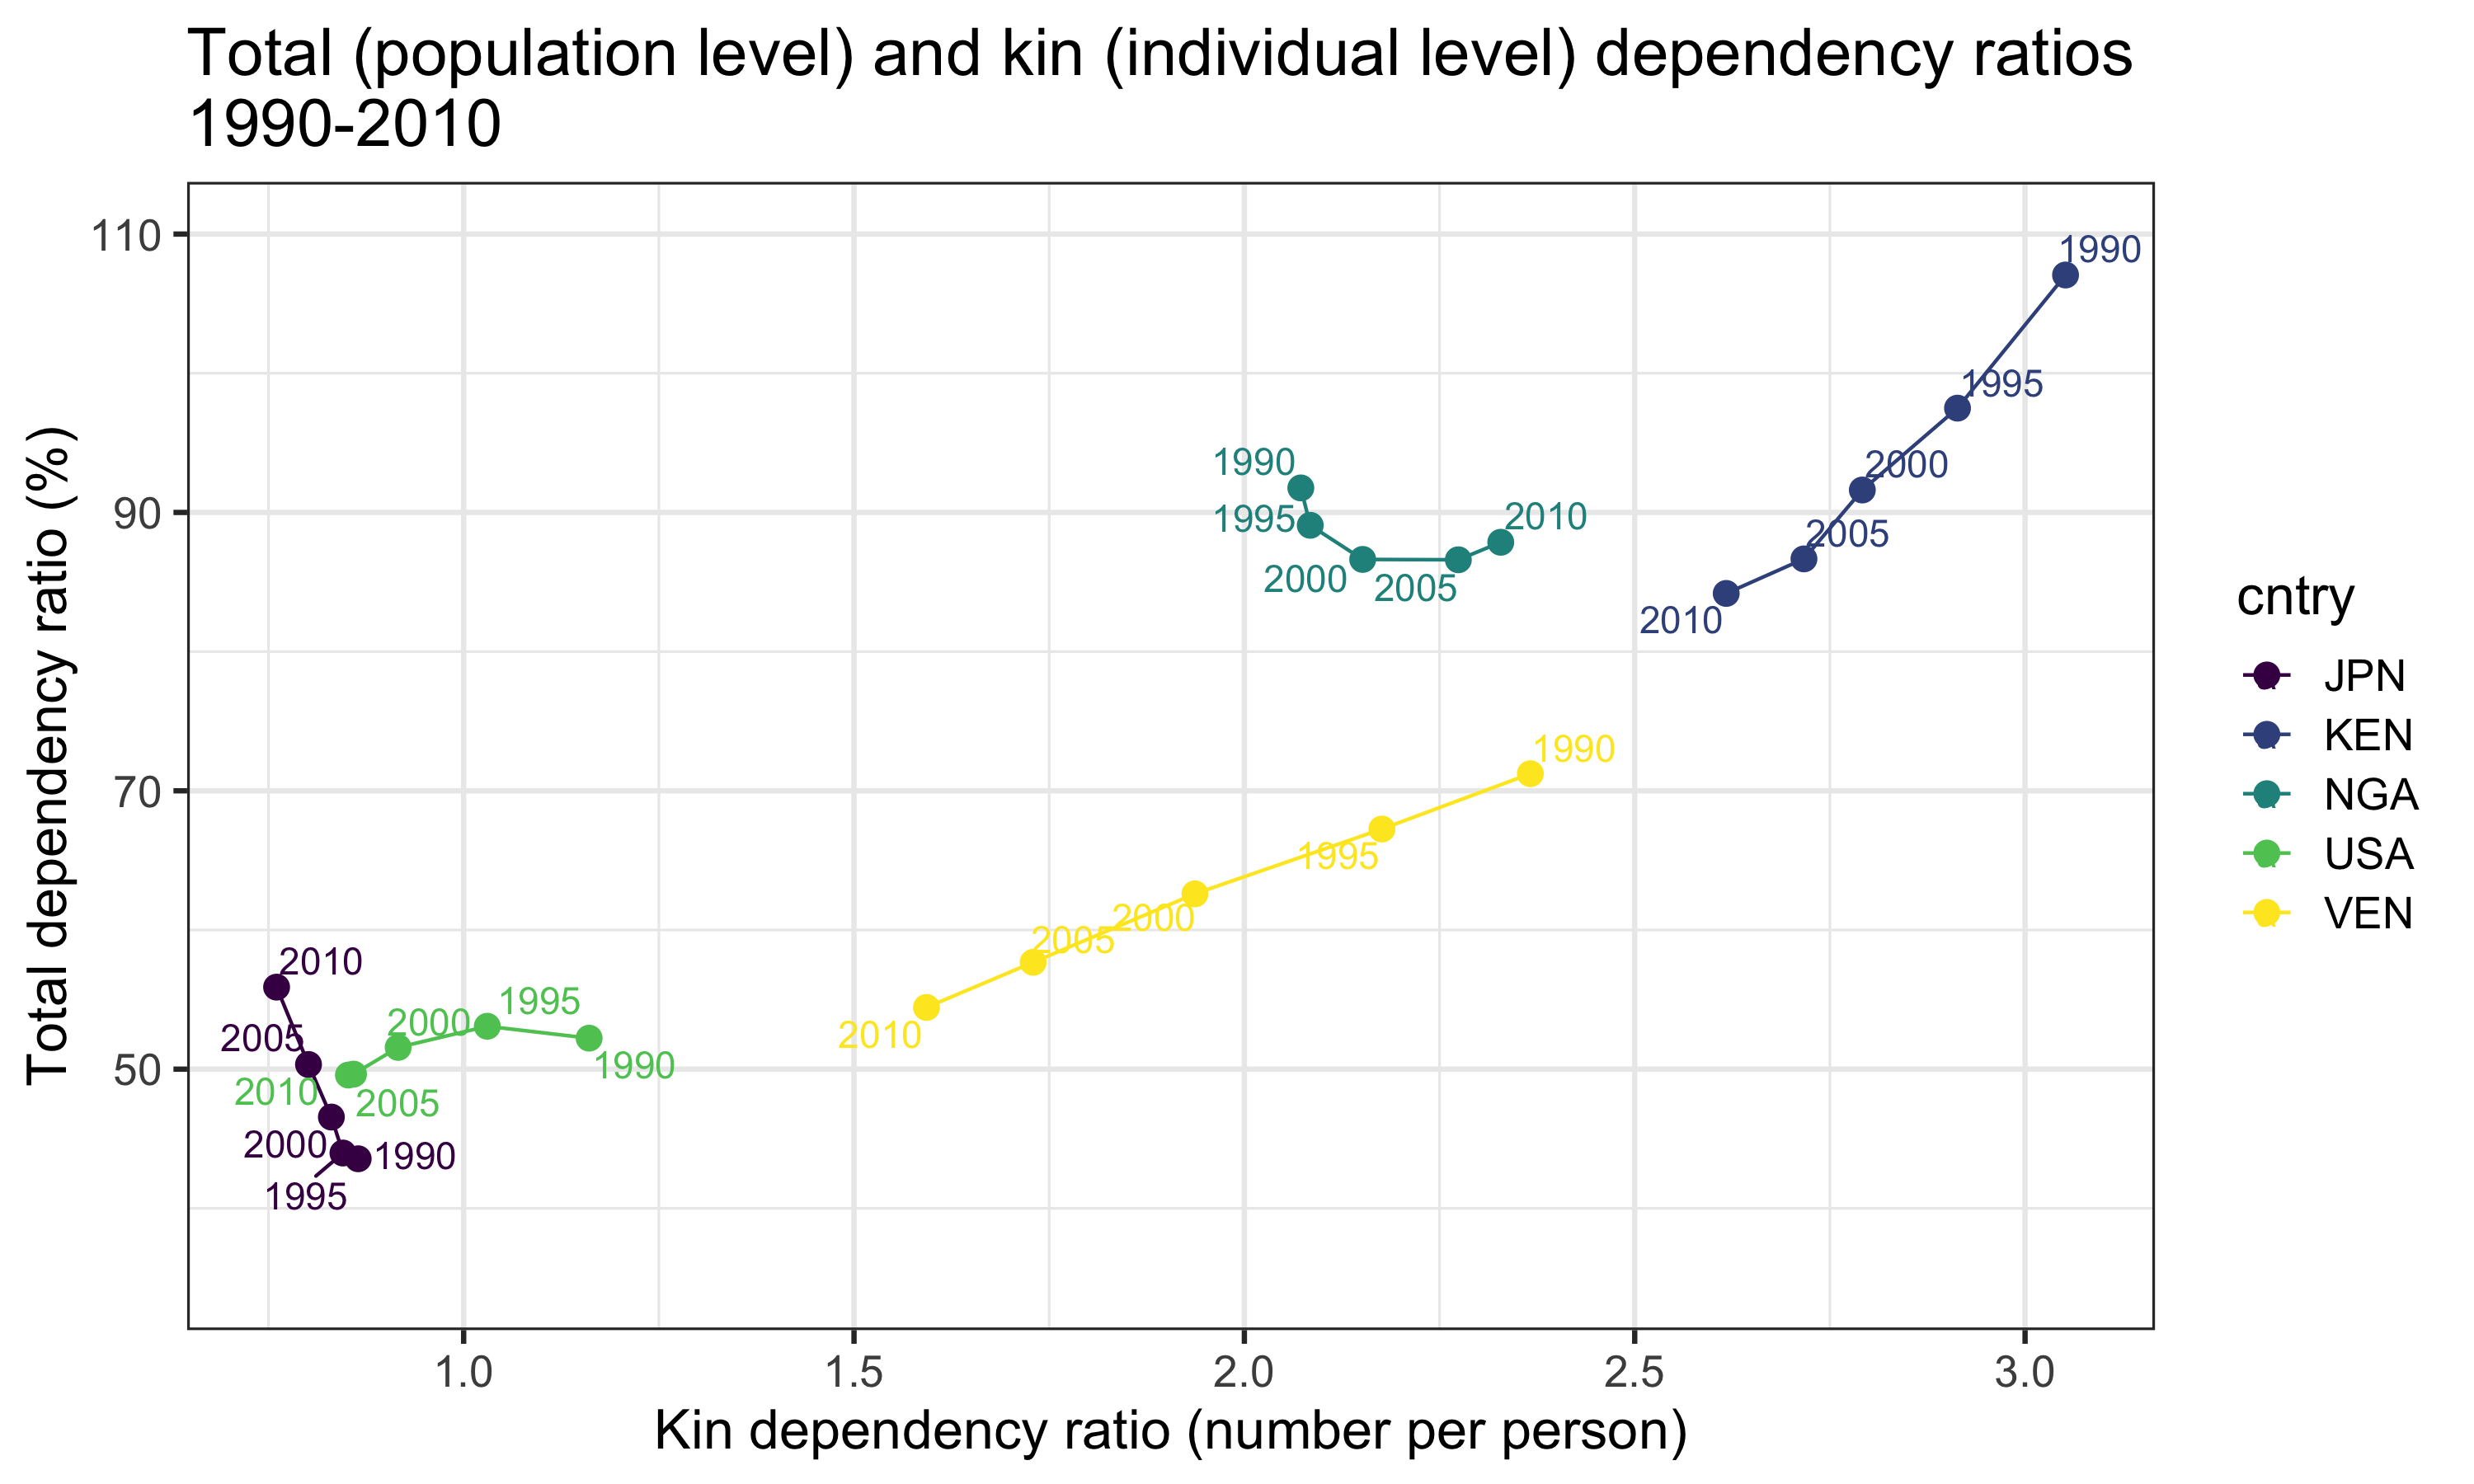
In general, we observe what we expect: KDR tends to increase along with TADR. That is to say, as the ratio of “dependent” age groups to the “working-age” group increases, so too does the ratio of “dependent” kin to non-“dependent” kin. However, this association does not hold perfectly in all cases. If we look closely at the plot in Figure 4, we see that the relationship between KDR and TADR varies greatly across different national contexts (Figure 5).
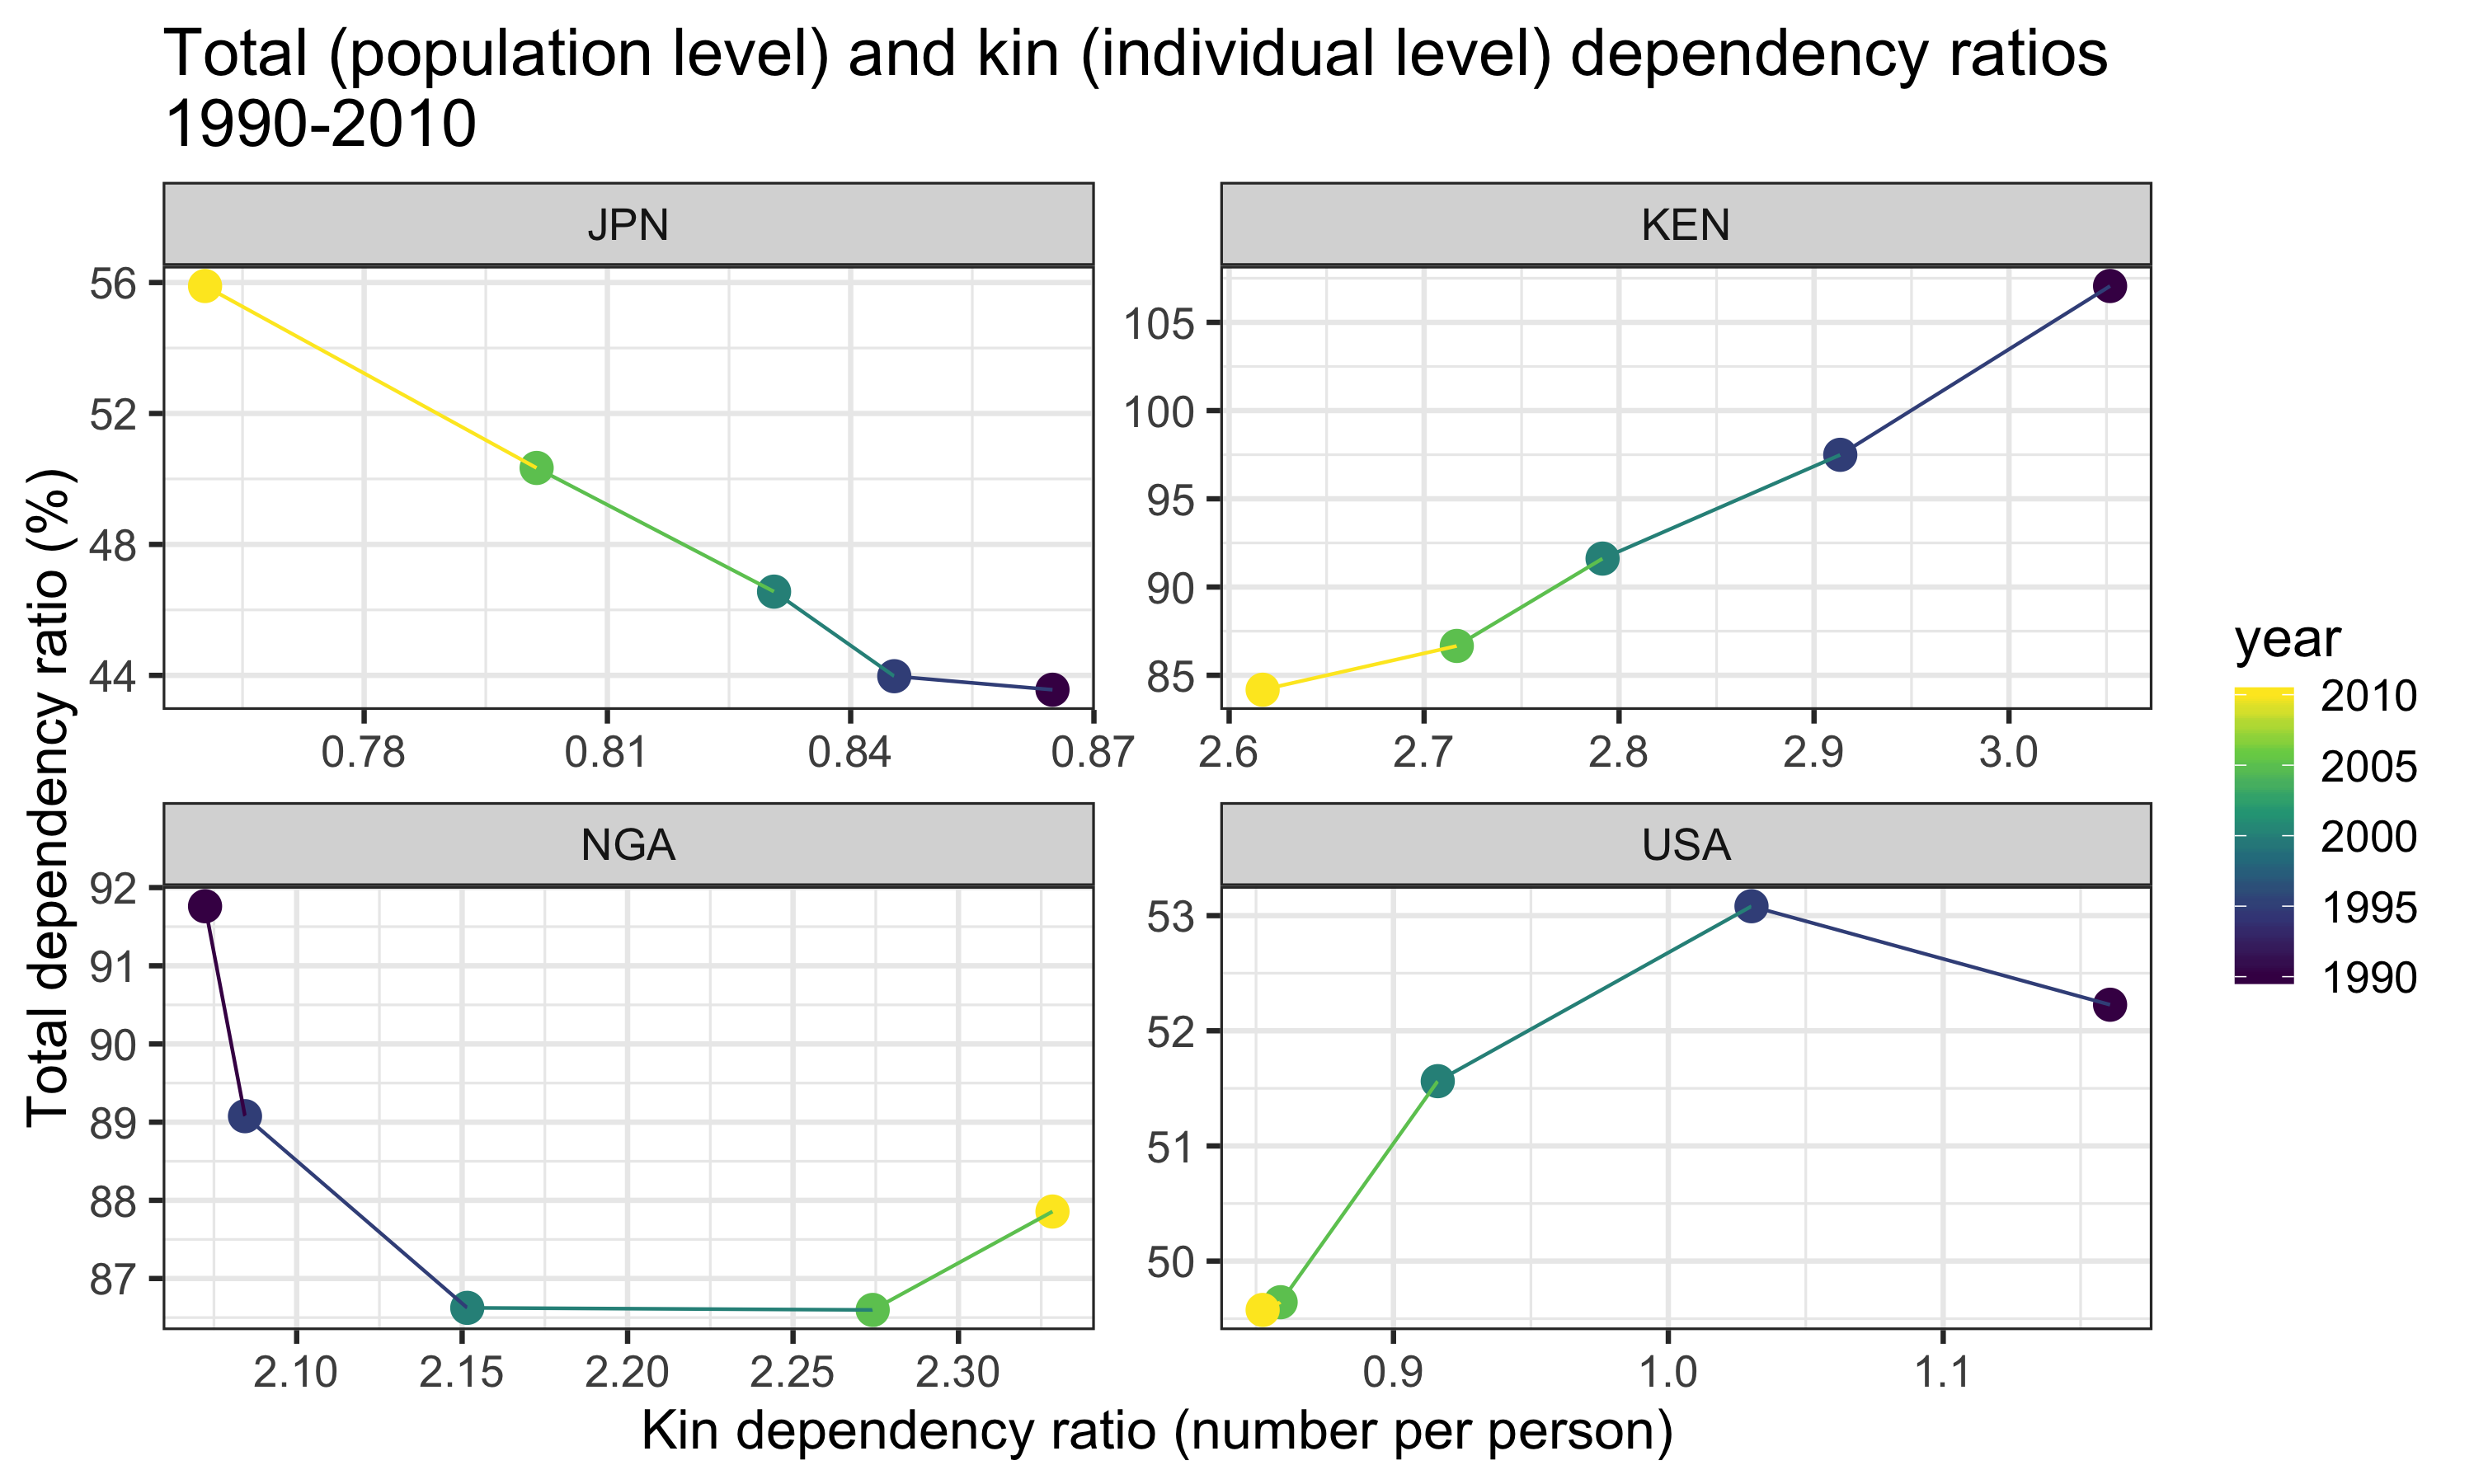
In Kenya, for example, we see a positive, linear correlation between KDR and TADR. This aligns well with the general trend observed in Figure 4: TADR and KDR increases or declines at roughly similar speeds. In all of our other countries, however, we see deviations from this canonical pattern. In the USA, there is also a net positive relationship between KDR and TADR, but that relationship does not appear to be linear—KDR does not always move in the same direction as TADR. In Nigeria, there appears to be a weakly negative relationship between KDR and TADR; and in Japan, this relationship appears to be strongly negative and very nearly linear—KDR actually declines as TADR increases.
In summary, the relationship between KDR and TADR is not constant. It can vary dramatically over time and across different national populations. To the extent that KDR and TADR can be interpreted as measures of, respectively, the private and public support burdens faced by countries, understanding the shape and source of the variation in the KDR-TADR relationship may help inform the future work of researchers and policy-makers as they prepare for the aging of their populations.
In the final paper, we plan to expand the scope of this project in four directions.
Account for additional kin relations: For the purposes of this extended abstract, we have only considered grandmothers, mothers, daughters, and granddaughters in our calculations, but in the final paper we intend to broaden our scope to include equations for other types of kin: sisters, aunts, cousins, and nieces.
Validate kin availability estimates: We will compare the estimates of kin availability derived via our method against kin counts derived from a set of nationally-representative surveys.5
Explain the variation in the KDR vs. TADR relationship: We will use country-specific time trends in fertility and mortality to explain the observed over-time variation in the KDR vs. TADR association in those countries. In particular, we will attempt to answer the question: under what conditions do we expect KDR and TADR to have a positive (or negative) relationship?
Build an R package: To enhance the practical usefulness of our method, we are preparing an R package that will enable researchers to easily implement it to derive expected numbers of kin given data on age-specific rates of fertility and mortality.
Goldman, Noreen. 1978. “Estimating the intrinsic rate of increase of a population from the average numbers of younger and older sisters.” Demography 15 (4):499–507.
Goodman, Leo A., Nathan Keyfitz, and Thomas W. Pullum. 1974. “Family formation and the frequency of various kinship relationships.” Theoretical Population Biology 5:1–27.
Hagestad, Gunhild O. 1986. “The aging society as a context for family life.” Daedalus 115 (1):119–39.
Lee, Ronald Demos, and Andrew Mason. 2011. Population aging and the generational economy: a global perspective. Cheltenham: Edward Elgar.
Lee, Ronald, and Gretchen Donehower. 2011. “Private transfers in comparative perspective.” In Population Aging and the Generational Economy: A Global Perspective, edited by Ronald Lee and Andrew Mason, 185–208. Cheltenham: Edward Elgar Publishing Ltd.
Sanderson, Warren C., and Sergei Scherbov. 2005. “Average remaining lifetimes can increase as human populations age.” Nature.
Uhlenberg, Peter. 1980. “Death and the family.” Journal of Family History 5:313–20.
United Nations, Department of Economic and Social Affairs, Population Division. 2015. “World Population Ageing 2015.” United Nations, Department of Economic; Social Affairs.
Watkins, Susan Cotts, Jane A. Menken, and John Bongaarts. 1987. “Demographic foundations of family change.”
For notable examples of work in this tradition see: Goldman (1978), Uhlenberg (1980), Hagestad (1986), Watkins, Menken, and Bongaarts (1987)↩
For an extensive review, see R. D. Lee and Mason (2011)↩
It is worth noting that alternative versions of the basic old age dependency ratio (OADR) measure have been proposed. Perhaps the most prominent of these is the prospective old age dependency ratio (POADR) (Sanderson and Scherbov 2005), which further adjusts for future gains in life expectancy.↩
All data are available online: https://population.un.org/wpp/↩
In the United States, for example, large-scale surveys like the General Social Survey and the Health and Retirement Survey contain questions regarding surviving family members.↩